 1:52
Open Swarm / Feature film
Operations: a recorded case — An alert arrives. Follow the evidence.
1:25 · English captions
The video could not load. You can download a copy below or reload this page.
In this film
The story
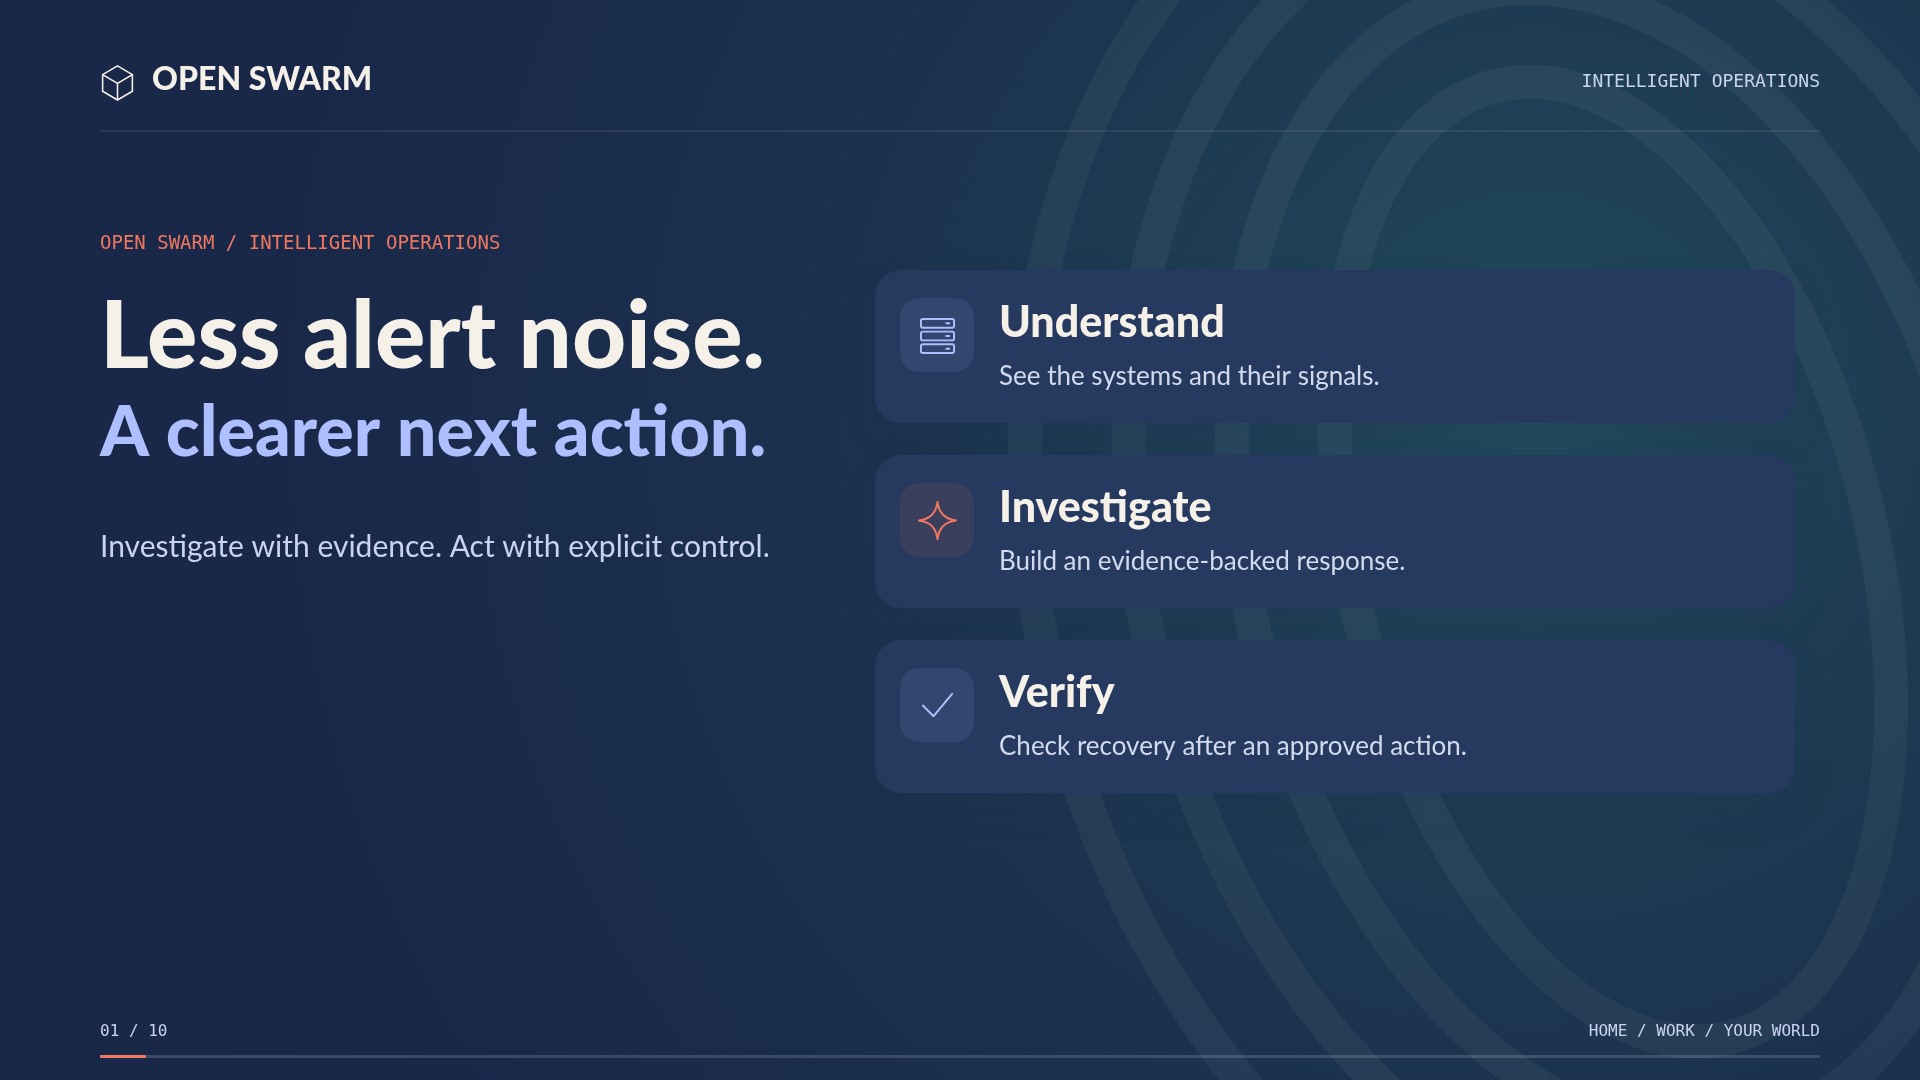
This recorded Operations lab case follows a real incident from alert to verified recovery. The timeline is condensed from a four-minute, forty-three-second test run. Provider-specific Operations connections bring in configured systems and signals. The separate Intelligent Processing application provides an alert queue; its documented ticket filing path is manual.
About the demonstrationA condensed walkthrough of a passed, recorded 4-minute-43-second lab run from October 23, 2026. No new fault was injected for this film.
Read the full transcript
0:00This recorded Operations lab case follows a real incident from alert to verified recovery. The timeline is condensed from a four-minute, forty-three-second test run.
0:11Provider-specific Operations connections bring in configured systems and signals. The separate Intelligent Processing application provides an alert queue; its documented ticket filing path is manual.
0:24In this lab, a CPU-pressure fault triggered the alert. The system admitted it at forty-four seconds, then a scheduled tick started the investigation.
0:35The agents investigated, reviewed, and revised the report. They prepared remediation and verification scripts, plus rollback and verification guidance.
0:46The operator approved the exact response files and target. The remediation ran once through the operator’s Kubernetes connection, and completed successfully.
0:57The alert resolved. Verification passed, the same target was healthy, and the approved report closed the ticket. This is one successful lab case, not a promise that every incident resolves automatically.
1:11Keep the chain visible: signal, investigation, approval, execution, and verified outcome. Intelligent Operations, inside Open Swarm.
Keep exploring.
All 49 films1:52